Most advice on TikTok shop growth is one seller’s story told as if it were a rule.
Raise your commission. Get bigger creators. Fix your conversion rate. Every one of those is repeated constantly, and almost none of it is measured against more than a handful of shops.
So we measured ours. We pulled a live census of all 121 TikTok Shops under Bullseye Sellers management — every stage from pre-revenue to $100K+ a month — and asked one question: what actually changes as a shop climbs?
The answer is narrower than we expected. Four things move with scale. One thing never does. And the hardest dividing line in the whole dataset has nothing to do with your product. Read our TikTok Shop benchmark data below.
What we measured
Every figure below was read directly from the TikTok Shop Partner Center across a 28-day window ending August 2026. It is a full census of all 121 managed shops, not a sample.
We grouped shops into five tiers by monthly GMV — T1 ($0–10K), T2 ($10–25K), T3 ($25–50K), T4 ($50–100K) and T5 ($100K+) — and compared twelve metrics across them: video volume, GMV per video, attribution mix, ad spend, ad-attributed GMV, cost per order, refund rate, conversion and commission.
No individual shop is named in this TikTok Shop benchmark article. All figures are tier averages.
The formula that explains most of the curve
Affiliate GMV is not one number you push. It is two numbers multiplied:
Affiliate GMV = number of creator videos × GMV per video
Both of those rise as a shop scales, and because they multiply rather than add, the gap between the bottom and the top of the curve is enormous.
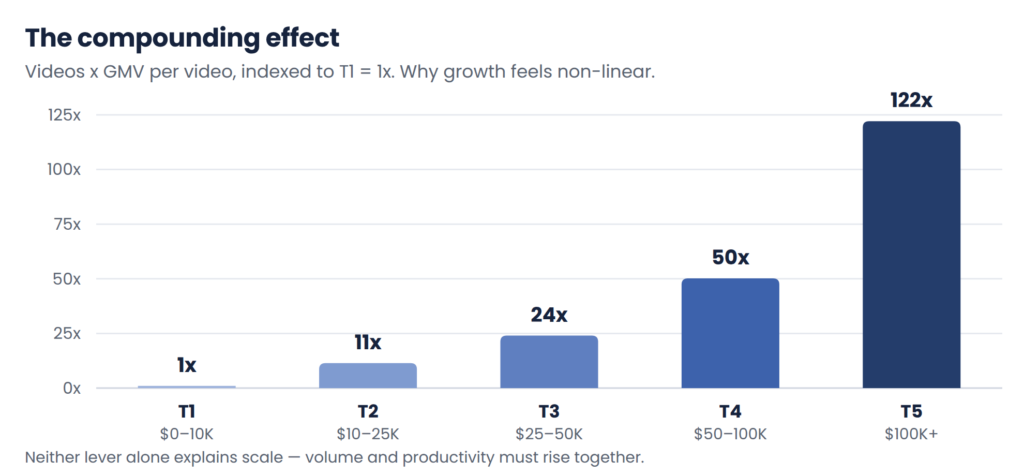

Videos × GMV per video, indexed to T1 = 1x. All 121 managed shops, 28-day window.
A top-tier shop produces roughly 122 times the affiliate output of a sub-$10K shop. Neither lever explains that on its own. Volume alone would get you about 7.5x. Productivity alone would get you about 16x. You need both, and you need them at the same time.
This is also why the early climb feels so much harder than the later one. At $5K a month you are fighting both levers from a standing start. At $60K, both are already working for you.
Lever one: creator video volume
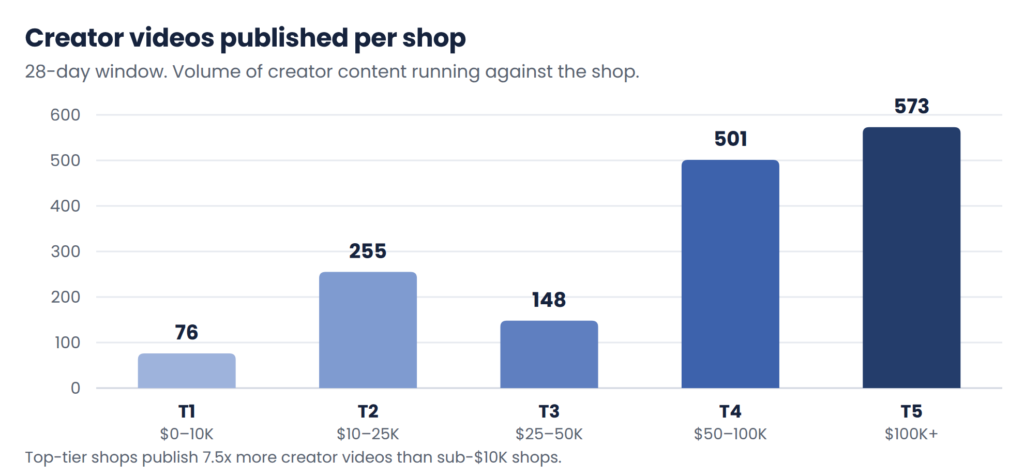
Creator videos published per shop, 28-day window.
Video volume climbs hard — but not smoothly. Look at T3.
Shops in the $25–50K band publish fewer videos than shops in the $10–25K band. That is the single most interesting anomaly in the dataset, and we will come back to what it means.
The headline: top-tier shops publish 7.5x more creator videos than sub-$10K shops. If you are stuck under $10K and you are counting your creator videos in dozens, that is your gap.
Lever two: GMV per video
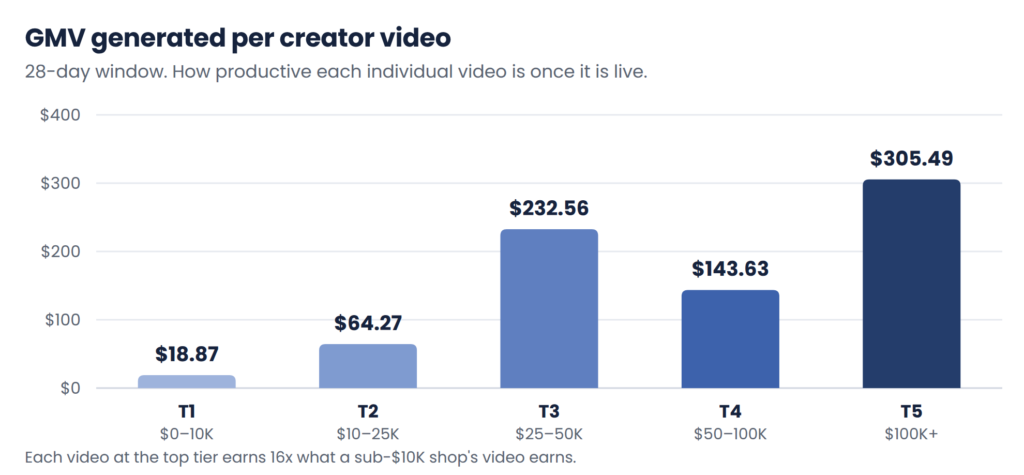
GMV generated per creator video, 28-day window.
A video working for a sub-$10K shop earns $18.87. The same video working for a $100K+ shop earns $305.49.
That is a 16x difference in productivity, and it is not because top shops found secretly better creators. It is because a creator posting against a shop with sales history, reviews and social proof converts at a completely different rate than one posting against a cold listing.
Which brings us back to T3. Those shops earn $232.56 per video on lower volume than T2 — the creators are good, there just are not enough of them. T3 is not a creator problem. It is an operations problem, and the refund rate confirms it: 7.2%, the worst in the portfolio.
Ads are the hardest dividing line in the book


Above $10K a month, paid ads are universal. Every shop, in every tier, from T2 upward, runs them. Below $10K, adoption is only partial.
Across 121 shops there was no meaningful population that scaled past $10K a month organically.
We want to be careful with that finding, because it is easy to hear as “spend more money.” It is not that. It is that ad spend produces the learning data and the conversion signal that the algorithm needs before it will show your product to people who did not search for it. Without that, creator video has nothing to amplify.
Scale makes ads cheaper, not more expensive
The most common objection we hear to raising ad spend is that efficiency will collapse. In this portfolio, it does the opposite.
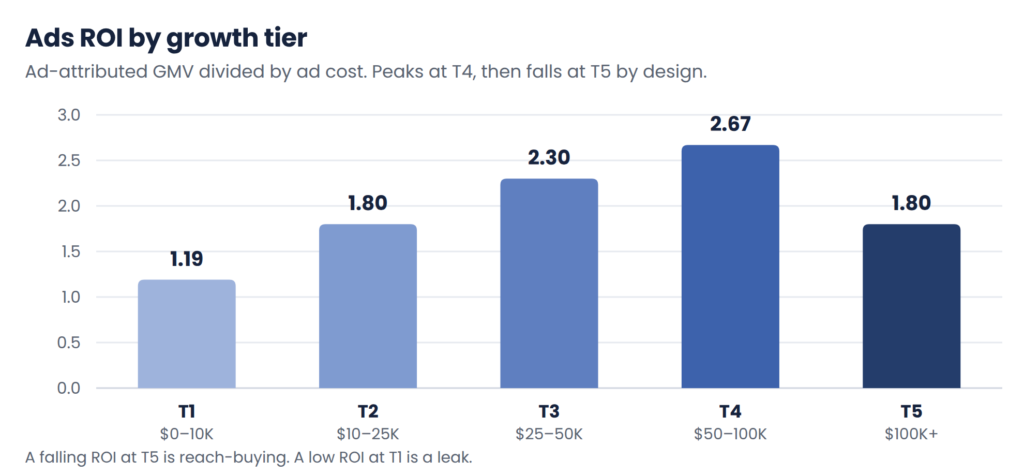
Ads ROI by growth tier. Ad-attributed GMV divided by ad cost.
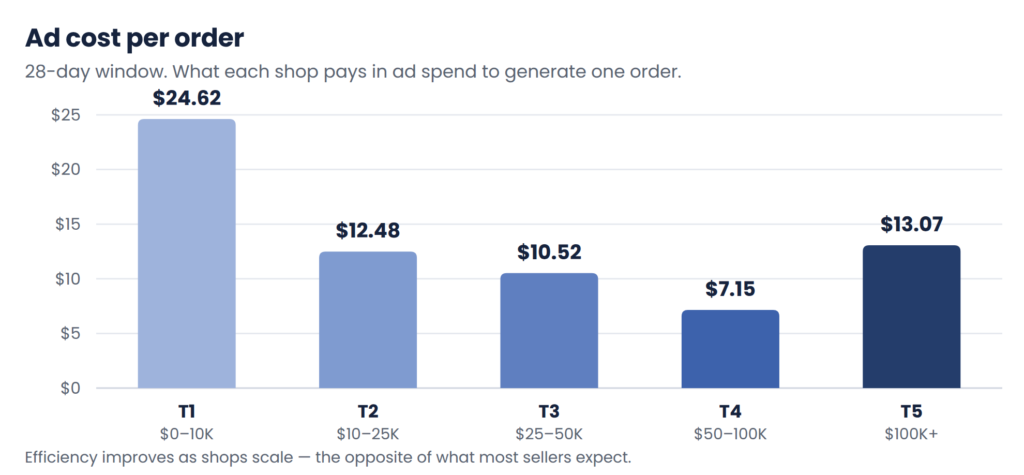
Ad cost per order, 28-day window.
Cost per order falls from $24.62 to $12.48 to $10.52 to $7.15 as shops climb. A sub-$10K shop pays roughly 3.4x more than a $50–100K shop for the identical order.
ROI improves the whole way to T4, which at 2.67 is the maximum-leverage zone in the entire book. Every incremental dollar of ad spend and every additional creator returns more at T4 than anywhere else on the curve.
Then it drops at T5, and that drop is deliberate. The largest shops run lower ROI targets on purpose while organic video is hot, buying reach and letting part of the return land on Amazon branded search, Subscribe & Save and DTC instead.
Read a falling ROI at the top as strategy. Read a low ROI at the bottom as a leak.
Commission is not the lever
Every tier pays between 13.6% and 17.1% commission. The biggest shops pay less — 14.9% — than mid-tier shops at 17.1%.
If raising commission scaled shops, that relationship would run the other way.
There is one real caveat, and it runs in the opposite direction: at launch, a sub-10% offer gets ignored entirely, because creators screen on expected earnings before they screen on product. Commission is a threshold you have to clear, not a dial you push. Clear it, then go spend your attention on video volume.
The one metric that never improves
Every tier converts between 3.4% and 3.9%.
Bigger shops are not better at converting. They put far more qualified traffic in front of the same funnel.
So when someone sells you “fix your conversion rate” as the growth lever, check it against this. In a 121-shop census, conversion rate is the one number that does not move with scale. Traffic volume through creators and TikTok ads is what moves.
What each phase’s job actually is
Each tier has one dominant constraint. Solving the wrong one is the most expensive mistake at every stage.
T1 — $0 to $10K: break the cold start
Two gates have to open together: seed real sales history so creators will engage, and get TikTok ads live. Product-card GMV sits at 26% here versus 13–14% at scale, which means the shop is surviving on browse traffic rather than creators. A seeding campaign compresses this phase — verified purchase velocity creates the sales history that unlocks creator vetting, plus a voluntary review base that lifts Shop Performance Score.
T2 — $10K to $25K: multiply creator count
Video volume has to roughly triple, from 76 to 255. This tier pays the highest commission in the portfolio and carries the highest affiliate dependence, because it is buying its way into creator attention. Accept the margin hit temporarily, and widen the roster so no two or three creators hold the shop hostage.
T3 — $25K to $50K: fix quality before adding fuel
Worst refund rate in the portfolio at 7.2%, and video volume actually drops versus T2. GMV per video is high, so the creators are fine. Fulfillment and product satisfaction are what cap Shop Performance Score here and choke the climb.
T4 — $50K to $100K: pour it on
Best ads ROI in the portfolio at 2.67 and the lowest cost per order at $7.15, with 501 videos per shop. If you are here, the correct move is almost always more — more spend, more creators, more inventory.
T5 — $100K+: buy reach, harvest off-platform
573 videos per shop at $305 each, with efficiency deliberately traded for visibility. The binding constraint stops being demand and becomes inventory and the halo — Amazon branded search, Subscribe & Save and DTC.
The full benchmark table
All 121 managed shops, 28-day window ending August 2026. Find your tier, then find the row where you are furthest off the benchmark.
| Metric |
T1 $0–10K |
T2 $10–25K |
T3 $25–50K |
T4 $50–100K |
T5 $100K+ |
| Creator videos per shop (28d) |
76 |
255 |
148 |
501 |
573 |
| GMV per video |
$18.87 |
$64.27 |
$232.56 |
$143.63 |
$305.49 |
| Video-attributed % of GMV |
71.0% |
83.7% |
76.4% |
85.1% |
82.4% |
| Affiliate % of GMV |
57.5% |
79.2% |
64.3% |
71.7% |
75.8% |
| Product-card % of GMV |
26.2% |
13.7% |
16.6% |
13.2% |
14.3% |
| LIVE % of GMV |
0.6% |
1.2% |
6.1% |
0.5% |
2.4% |
| Ads-attributed % of GMV |
80.3% |
81.5% |
97.0% |
97.1% |
107.5%* |
| Ads ROI (ad GMV ÷ ad cost) |
1.19 |
1.80 |
2.30 |
2.67 |
1.80 |
| Ad cost per order |
$24.62 |
$12.48 |
$10.52 |
$7.15 |
$13.07 |
| Refund % of GMV |
5.5% |
3.7% |
7.2% |
6.3% |
6.2% |
| Average conversion rate |
3.88% |
3.59% |
3.78% |
3.39% |
3.48% |
| Paid ads in use |
Partial |
Universal |
Universal |
Universal |
Universal |
| Commission rate paid |
15.1% |
17.1% |
13.6% |
16.0% |
14.9% |
*T5 ads-attributed GMV exceeds 100% because ad and organic attribution windows overlap on the same orders. That is normal at scale, not an error.
How to use this
Three honest limits first. This is one portfolio in one 28-day window, so treat these as directional benchmarks rather than universal constants. Tier averages hide real variance — a shop can sit well outside its tier’s numbers and be perfectly healthy. And some drivers of performance live inside each seller’s own Seller Center rather than the Partner Center, so they are not reflected here.
If you need support, partnering with a specialized TikTok shop agency can help identify your specific bottlenecks.
With that said, here is the practical use:
- Find your tier in the table, then find the row where your shop is furthest from the benchmark. That row is your bottleneck, not the one you have been worrying about.
- If you are under $10K and not running ads, that is the finding that applies to you. Nothing else on this page matters until it is fixed.
- If your cost per order is far above your tier’s benchmark, the gap is structural rather than budget — look at creative supply and conversion signal before you look at bids.
- If your affiliate share is above roughly 85%, you have a concentration risk rather than a growth engine. Build product-card and owned demand alongside it.
And if you can find your tier here but not your next move, that is the conversation we are good at. View the benchmark report in PDF format here.
Bullseye Sellers is a leading TikTok shop management agency that has managed ecommerce growth since 2018 across Amazon, TikTok Shop and Shopify. The full benchmark report is available as a free download — no email required.
bullseyesellers.com · info@bullseyesellers.com · (727) 349-1555